Economic balance
Assets respond differently to growth and inflation surprises. A portfolio should not quietly make one dominant macroeconomic bet.
A deliberate barbell for long-horizon investors: one bounded Nasdaq-100 growth pole, five defensive sleeves, and no pretense that the middle is automatically safe.
The goal is not to make every sleeve moderate. It is to seek growth where we mean to take risk, then hold enough liquidity and macro defense to survive being wrong.
Assets respond differently to growth and inflation surprises. A portfolio should not quietly make one dominant macroeconomic bet.
Fat tails, nonlinear damage, and estimation error make fragility more important than a neat average. Liquidity has option value when disorder arrives.
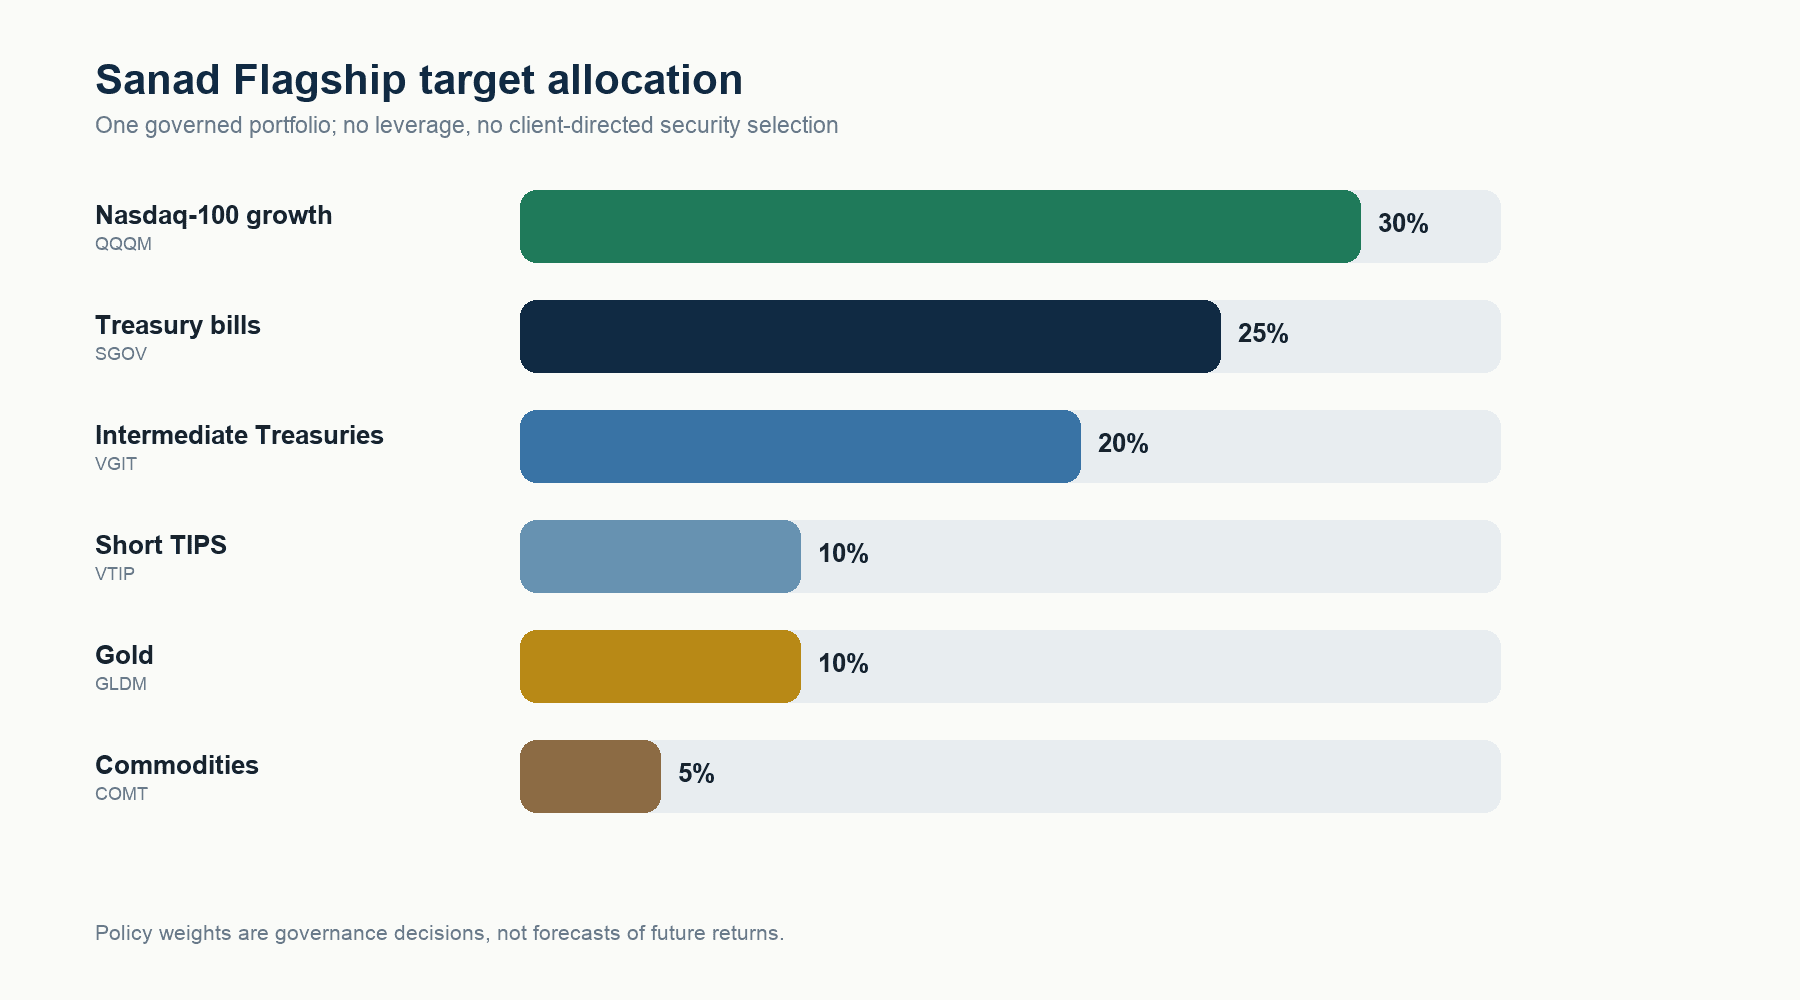
Bound the concentrated growth pole at 30%, refuse leverage, and version every policy change. This is robust and barbell-shaped—not inherently antifragile.
Thirty percent is an explicit Nasdaq-100 growth bet. Fifty-five percent sits in Treasuries and short TIPS. The remaining fifteen percent holds real assets for inflation and monetary disorder.
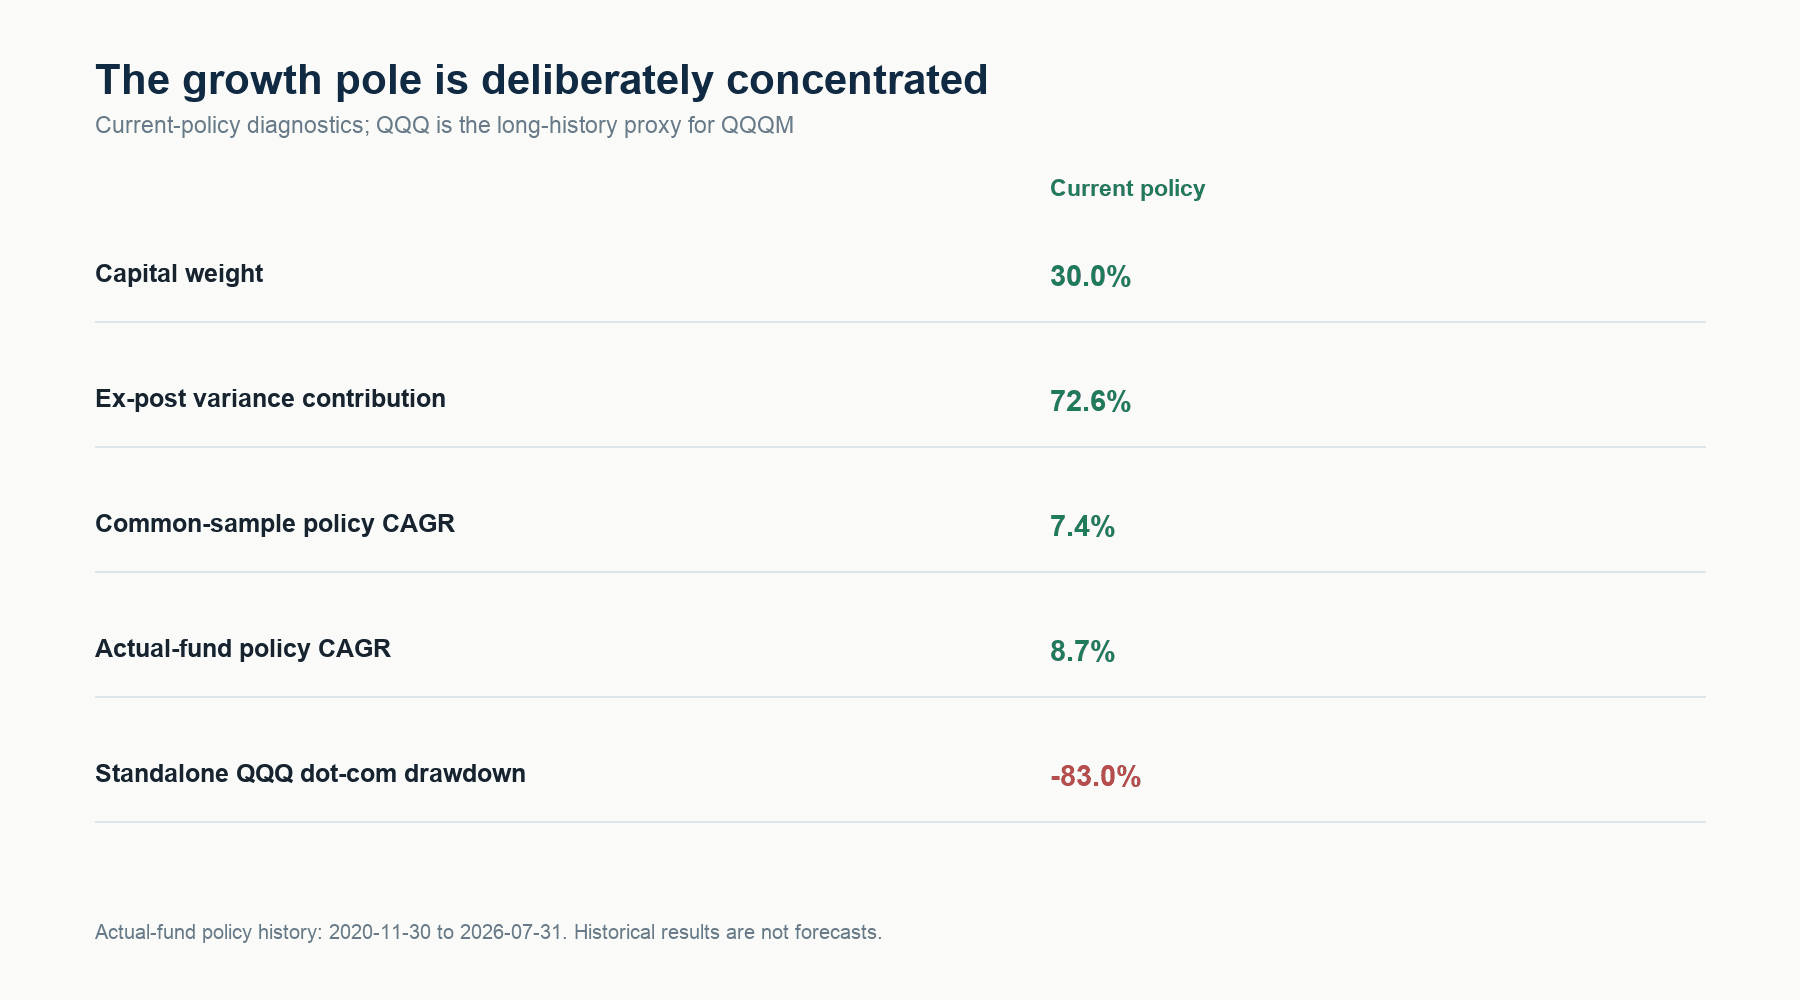
The QQQ proxy contributed roughly 73% of estimated portfolio variance. Capital balance is not the same as risk balance.
The concentration is deliberate and bounded. The remaining 70% supplies liquidity and macro defense; it does not make the Nasdaq-100 sleeve safe.
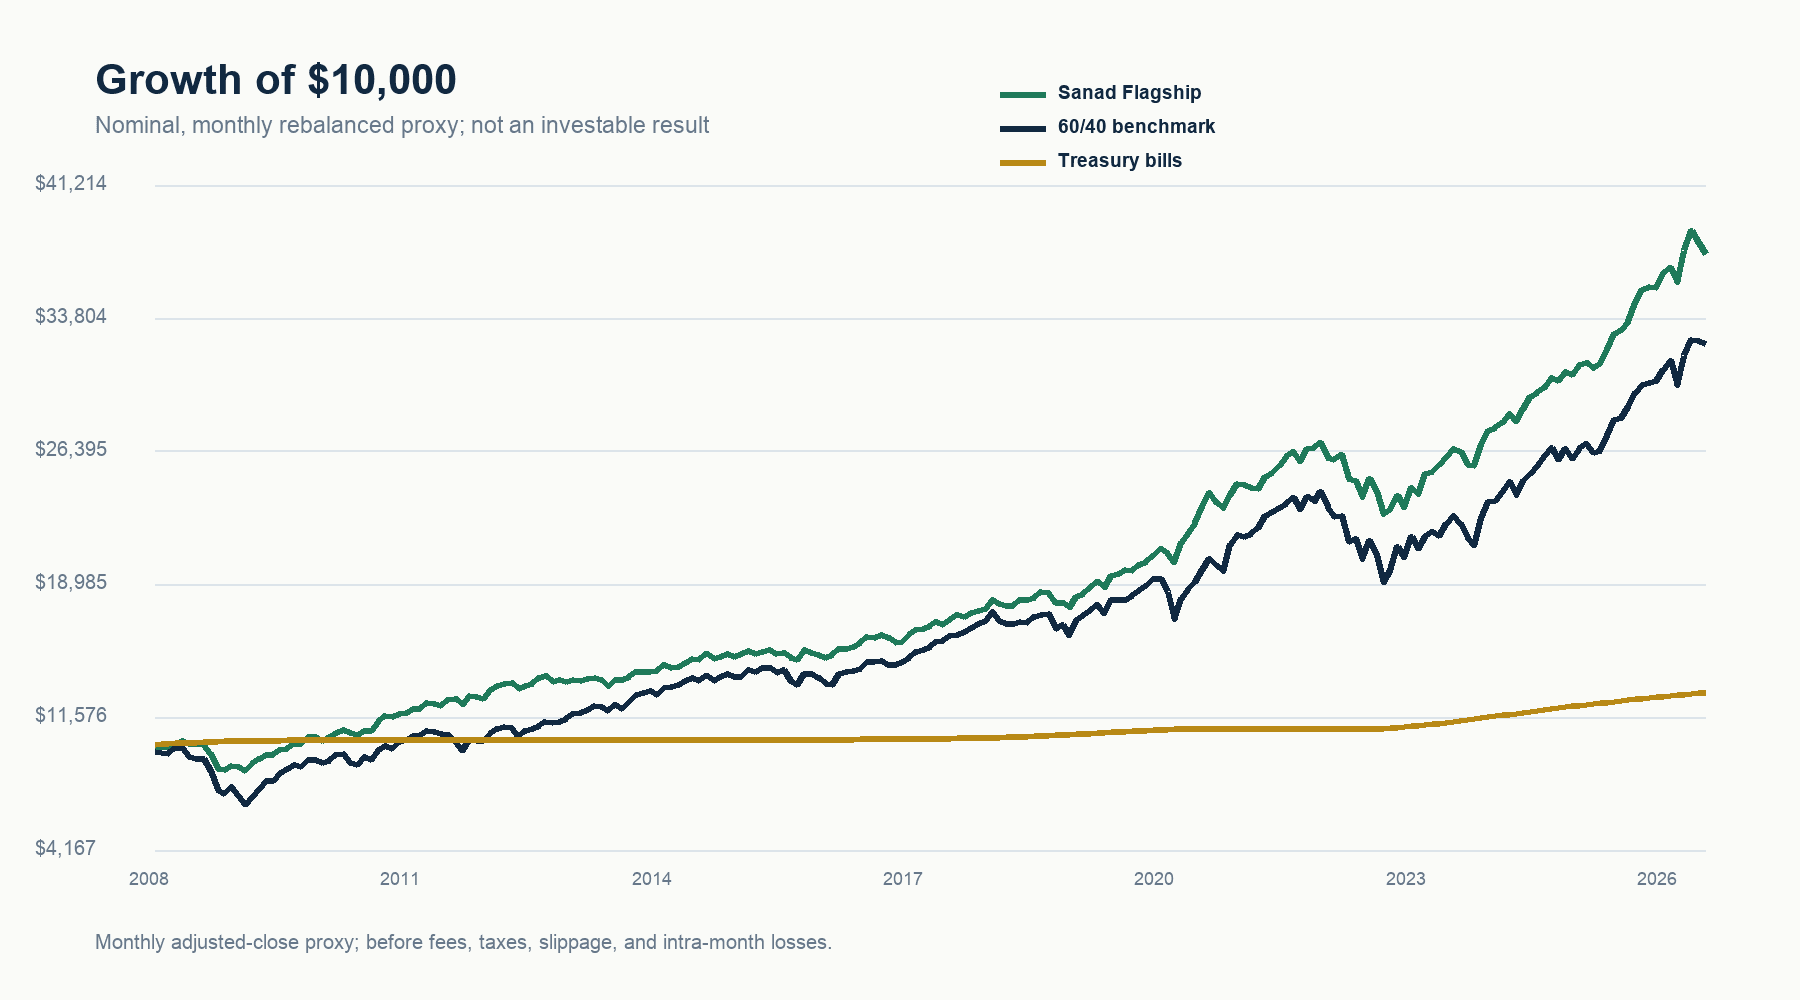
“Middle-risk trap” is a product-design critique, not a theorem. QQQM is concentrated, valuation-sensitive, and capable of decade-long recovery periods.
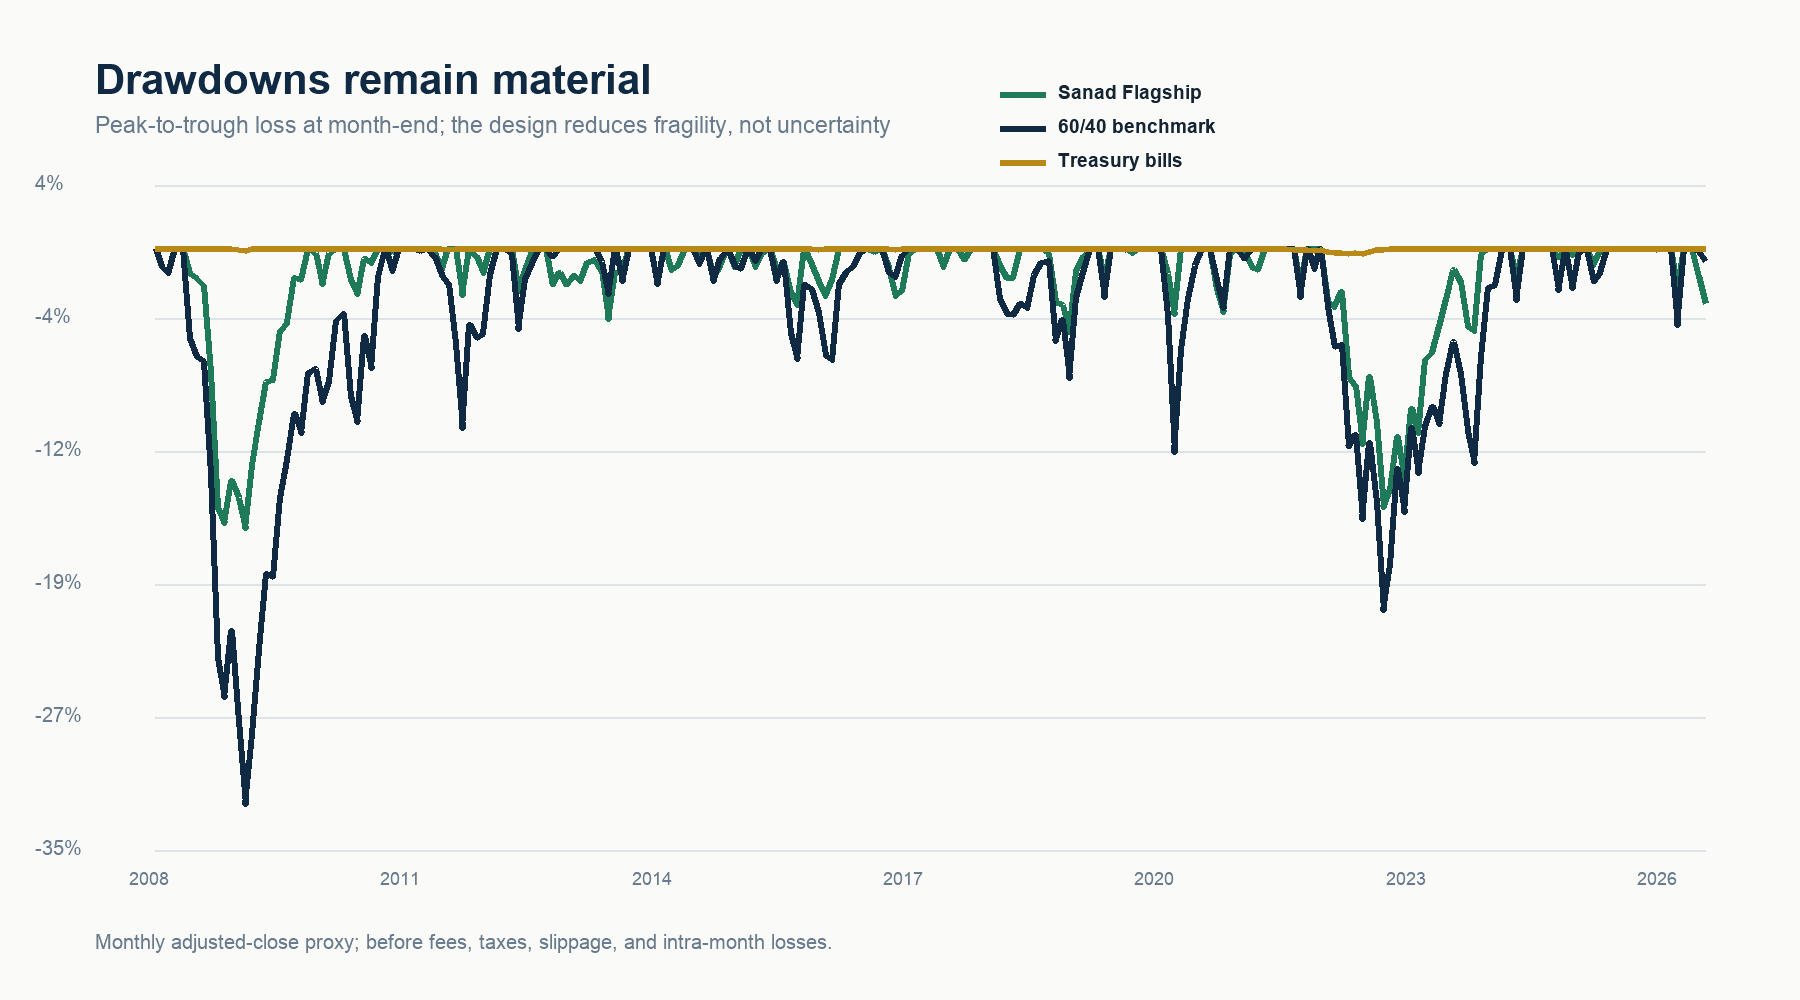
The QQQ proxy version beat 60/40 on return and recorded less drawdown in this window. That is evidence to examine, not a premium we can promise—especially because the window starts after the dot-com collapse.
Defensive assets did not maintain one stable relationship with equities. That is why no sleeve gets to carry the entire burden of protection.
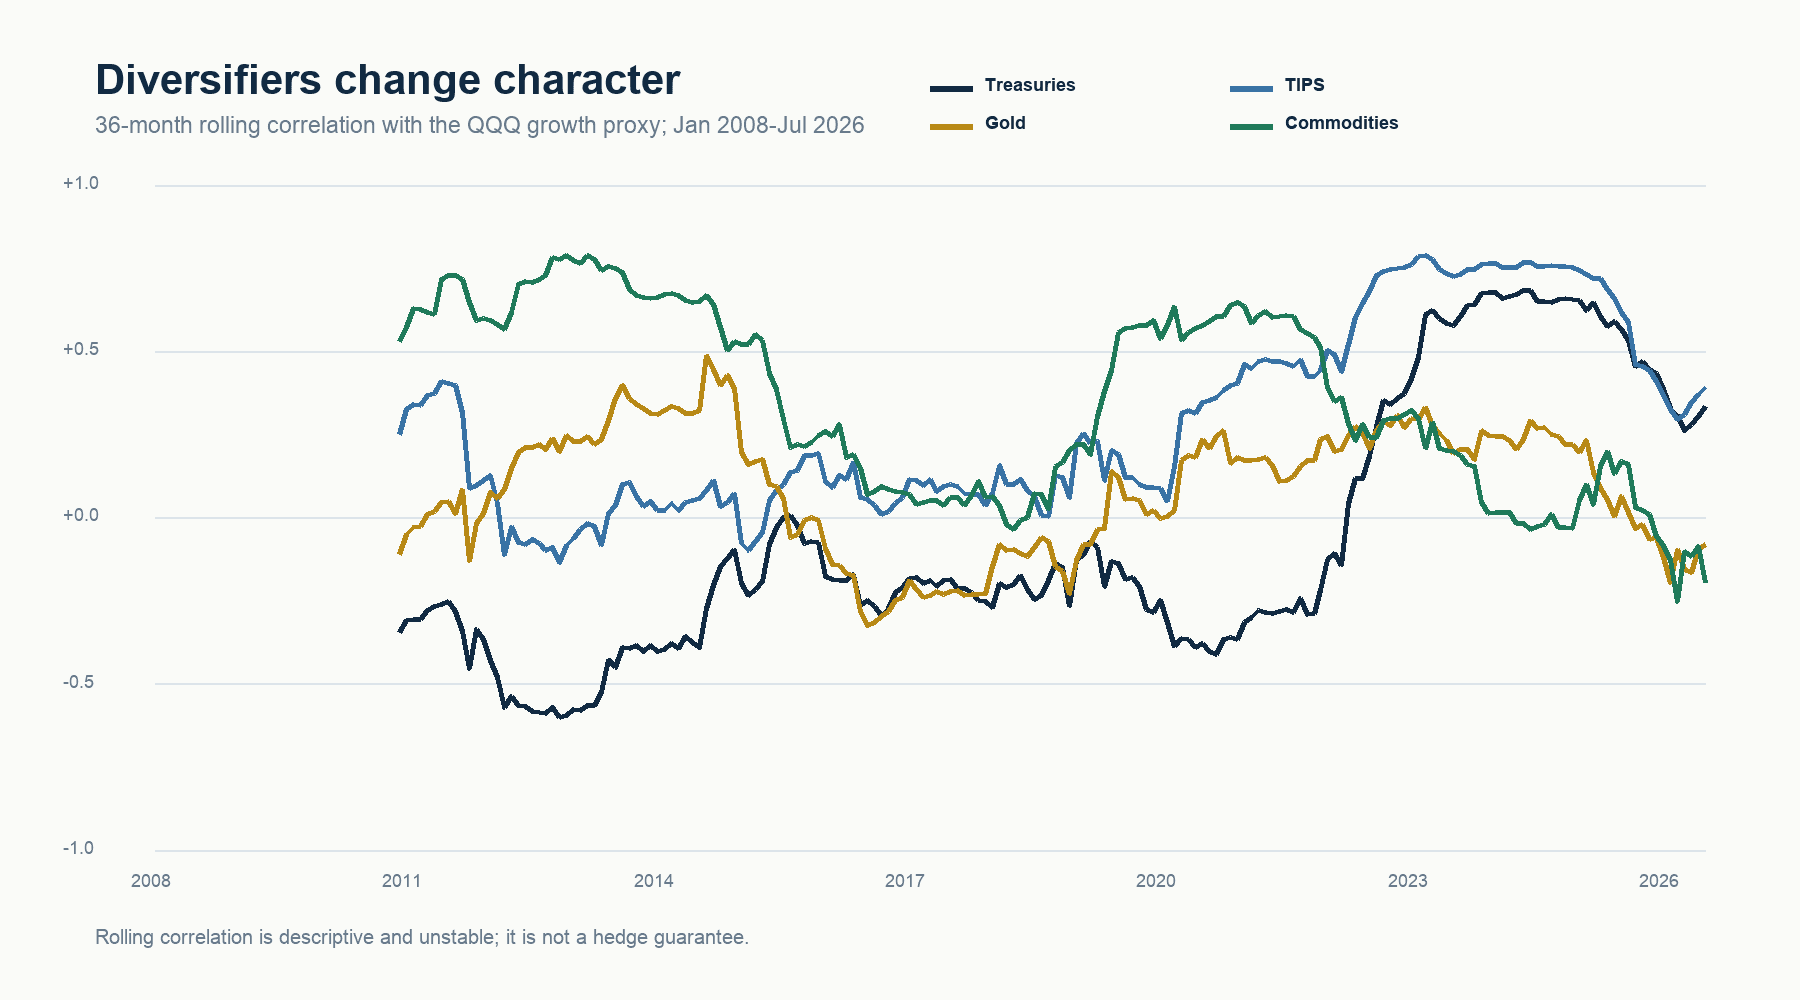
Latest values are sample observations, not forecasts. Treasury diversification weakened materially near the end of this window.
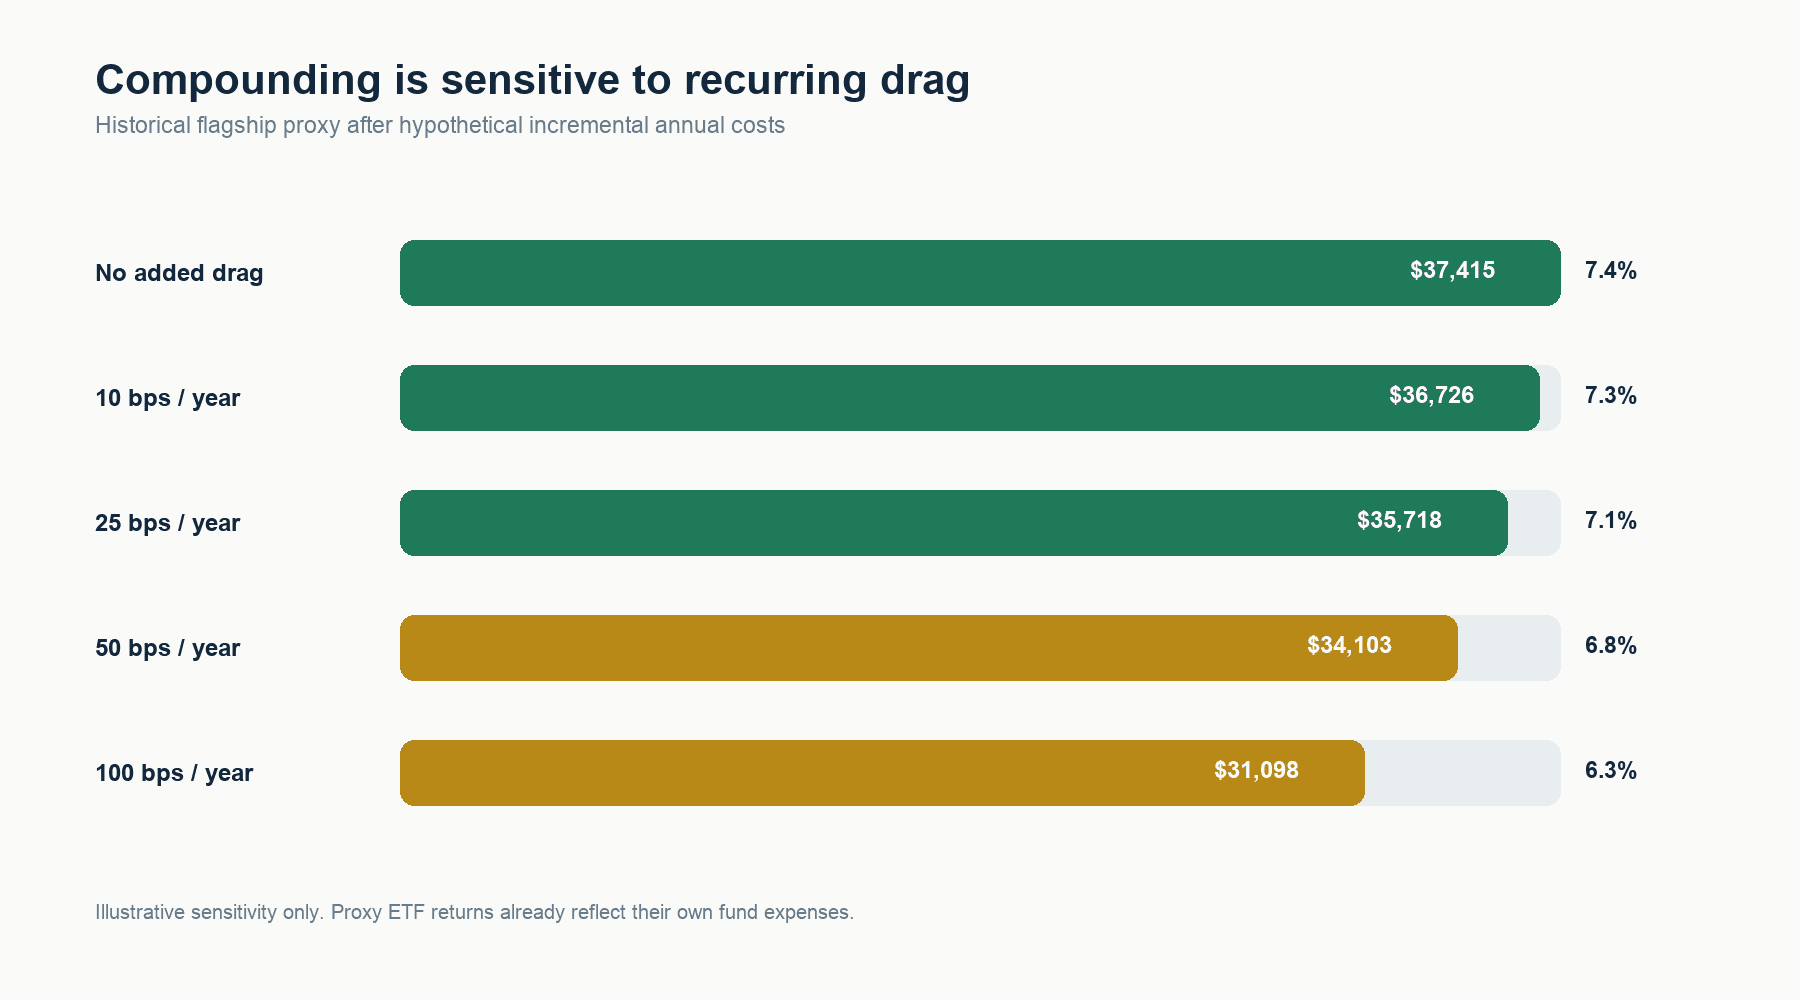
We model fund expenses and trading friction instead of treating the gross backtest as investable. Drift bands reduced sample turnover, but they are an operational rule—not a return promise.
In the same sample, forced monthly rebalancing produced 223 events and 14.19% annual one-way turnover. The comparison excludes taxes and market impact.
Diversification is not immunity. In a crisis, correlations can change and liquid assets can fall together. The design aims to reduce fragility, not manufacture certainty.
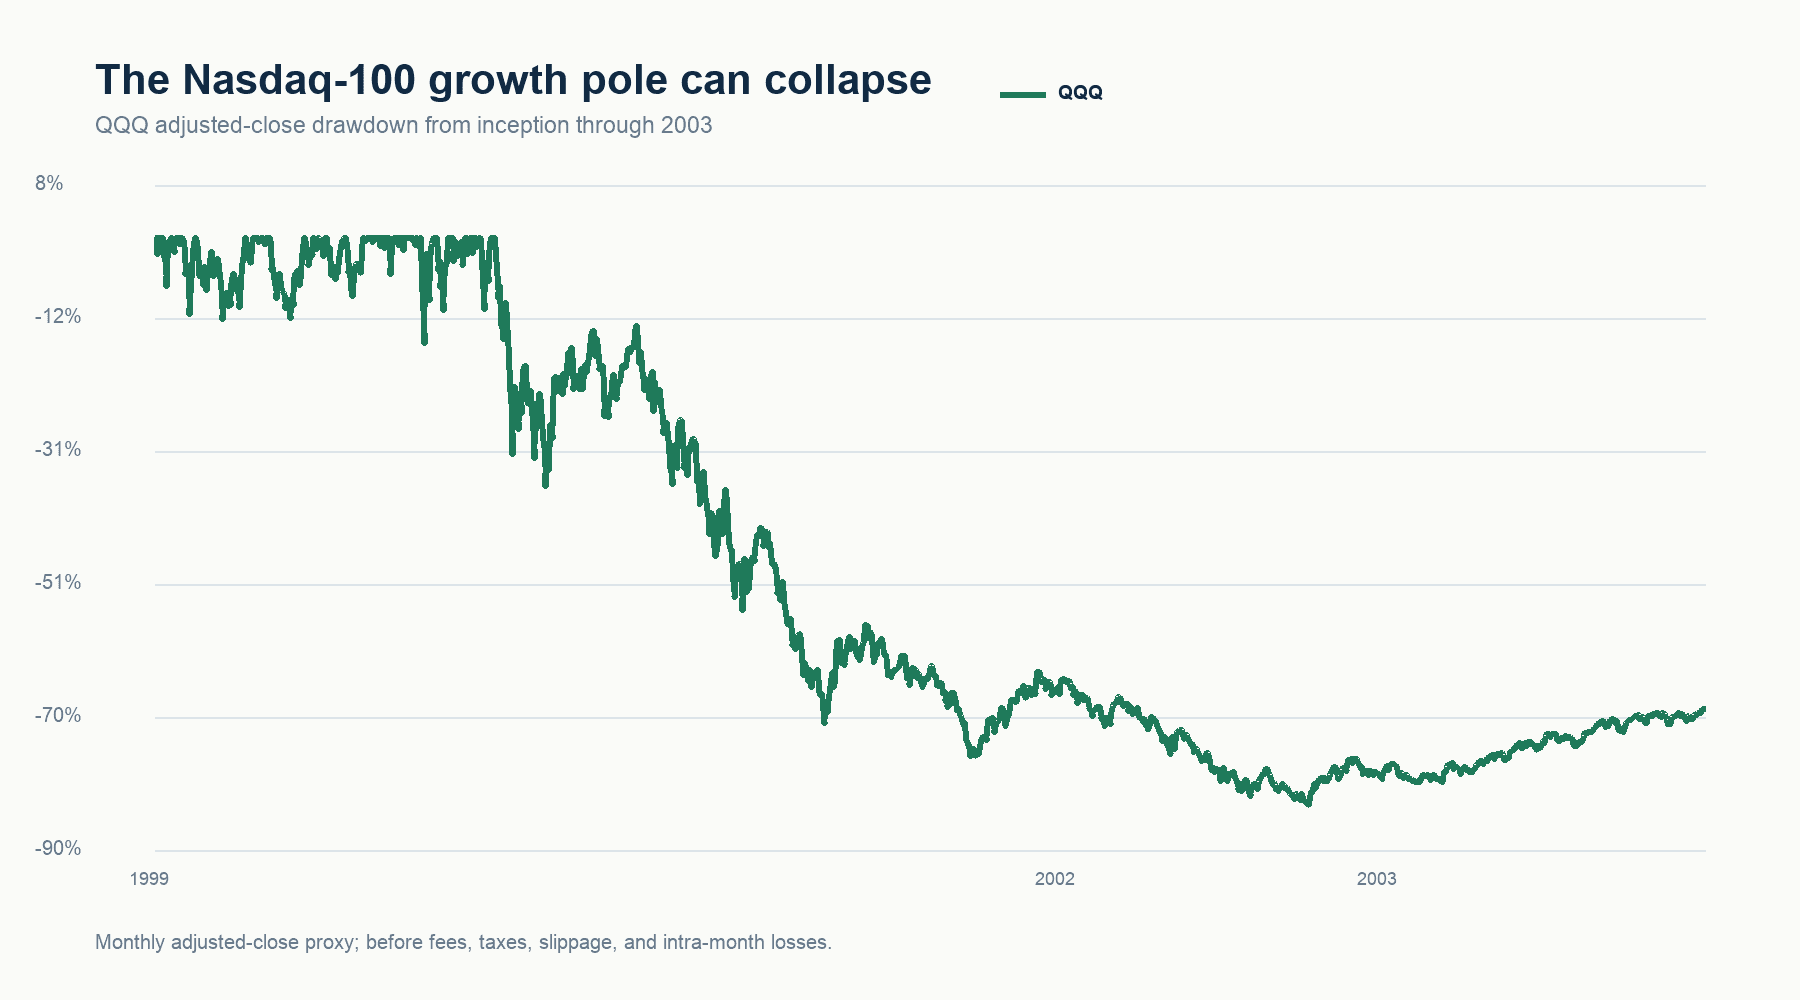
QQQ fell 82.96% from March 2000 to October 2002 and did not regain its prior adjusted-price peak until February 2015. The common portfolio sample begins in 2008, so this counterexample must remain visible beside every higher-return claim.
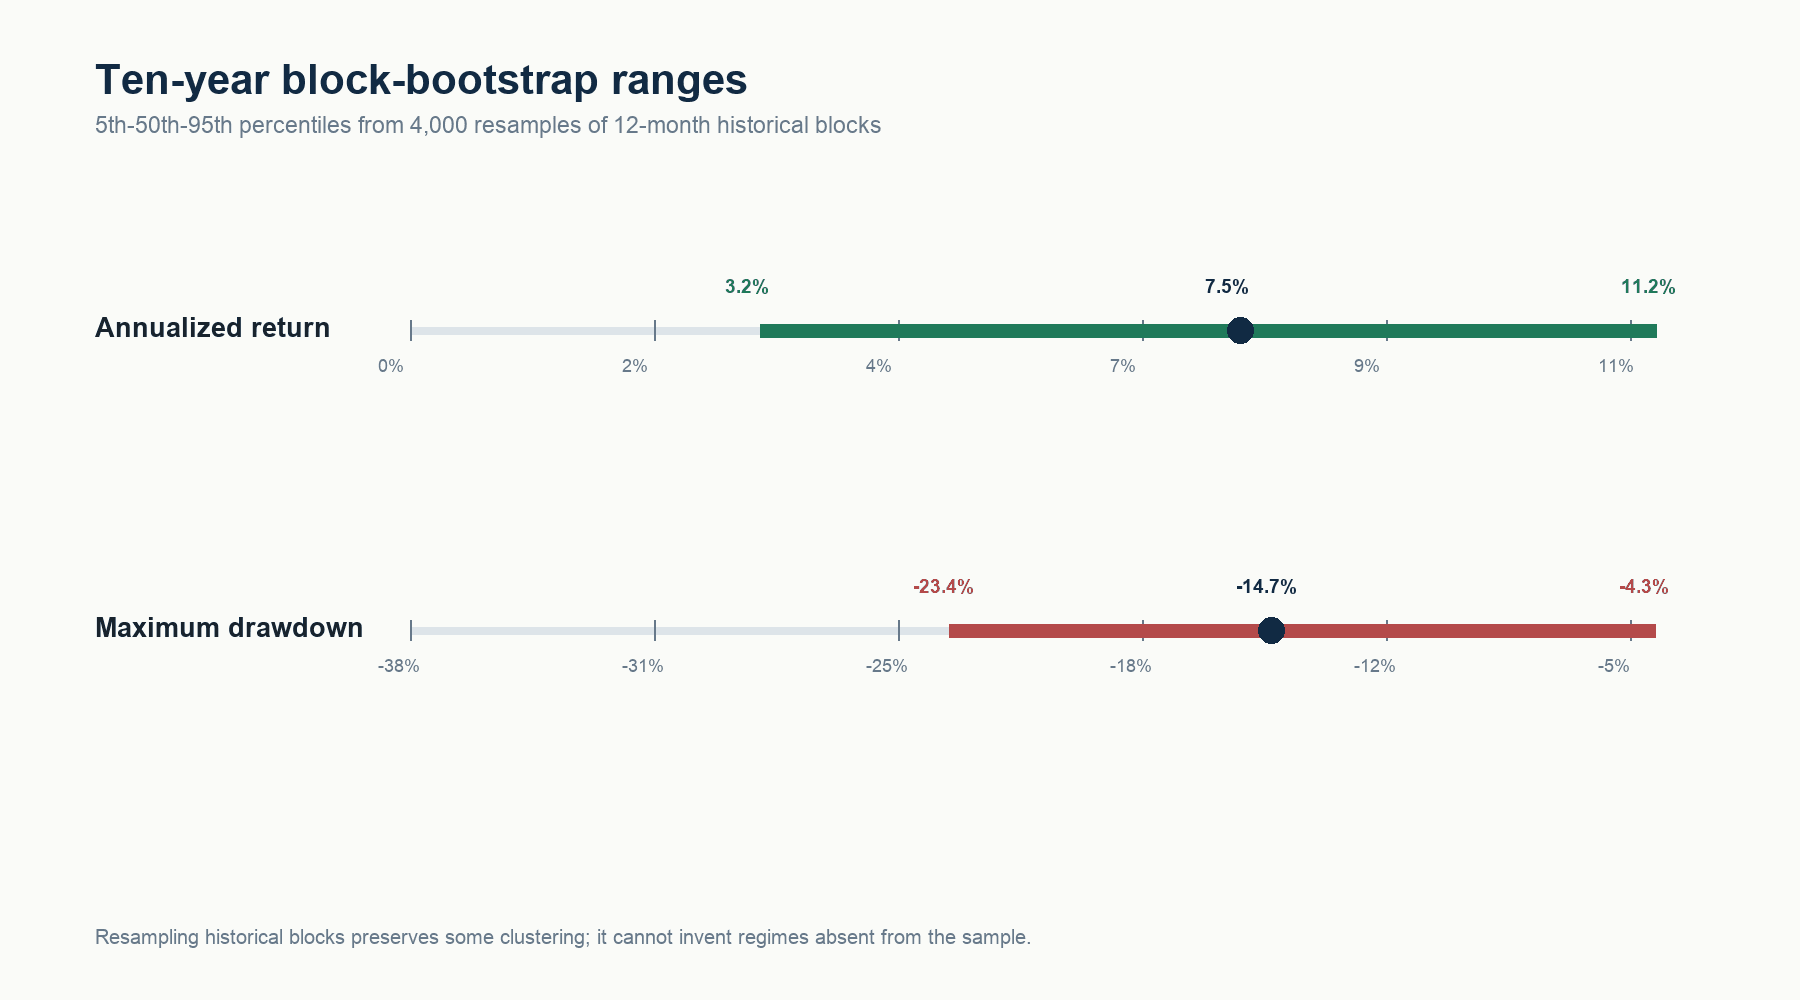
A 4,000-path block bootstrap preserves some historical clustering and illustrates outcome dispersion. It does not assign probabilities to the future or invent regimes absent from the sample.
Over ten-year resamples, annualized returns ranged from 3.2% to 11.2% between the 5th and 95th percentiles. Maximum drawdown ranged from −23.4% to −4.3%.
Clients do not edit securities or weights. The backend owns the approved strategy, and every material change creates a new immutable version.
Monitor drift, liquidity, data quality, and account restrictions.
Document the evidence, tradeoffs, operational impact, and failure modes.
Record committee approval, effective date, and version identifier.
Use cash first, respect drift bands, and avoid leverage or forced turnover.
Confirm fills, positions, cash, and exceptions against the custodian.
The paper explains the regime framework, fat-tail mathematics, portfolio construction, historical proxy, bootstrap analysis, implementation rules, and the claims this evidence cannot support. The companion workbook exposes the monthly series, rolling correlations, cost cases, sources, and formula checks.
This material is research, not individualized investment advice, a recommendation, an offer, or a guarantee. Historical proxy results are hypothetical and may not reflect fees, taxes, spreads, market impact, implementation constraints, or intramonth losses. Historical relationships can change. Any live implementation requires legal, regulatory, suitability, tax, liquidity, and operational review.